Learning to Filtering Client Traffic in OneFS
So I was hanging Instagram one day watching the Rock’s latest workout video…then all of a sudden I had a question slide into my DMs.
“Hey Thomas, Can you help me troubleshoot a specific client or protocol in OneFS?”
Of course you can! At least I thought so.
BTW my DMs are always open…
What is InsightIQ?
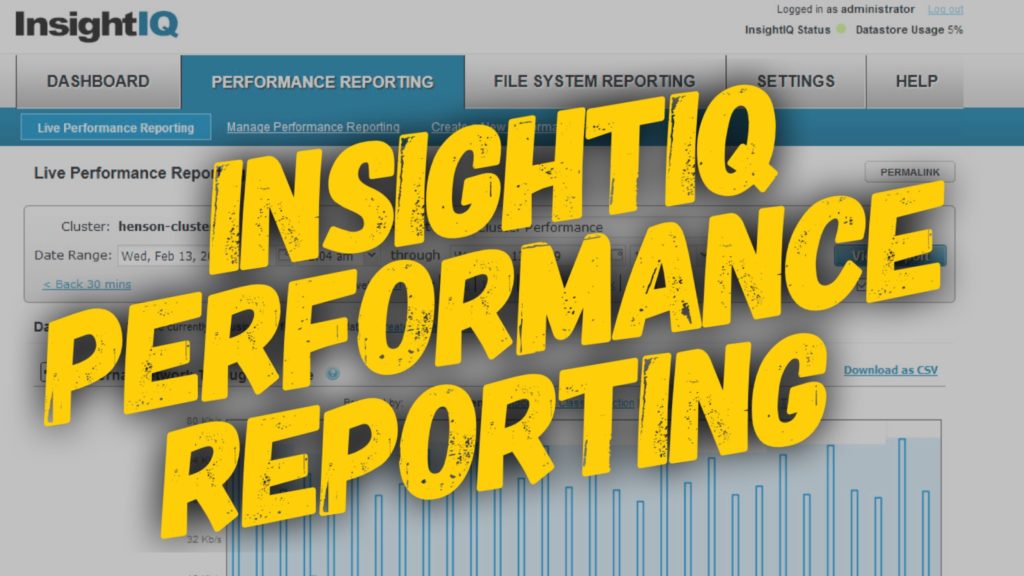
Well you actually can using a couple methods in InsightIQ. In OneFS InsightIQ is a software feature that allows you to analyze cluster performance and track data within your file system. InsightIQ runs outside OneFS in a VM monitoring OneFS clusters. There are quite a few ways to drill down into the data within InsightIQ, but one of my favorite features is the Data Filters. Checkout the video below to learn how to filter client traffic in OneFS.
Transcript – Data Filters in InsightIQ
Hi folks! Thomas Henson here with thomashenson.com. Today is another episode of Unstructured Data Quick Tips. Today, this question that we’re going to talk about is how to do some advanced searching with data filters and InsightIQ. This question actually came up from a viewer who was going through and trying to pull out some special reports on InsightIQ, so they reached out to me on Instagram and said, “Hey, you know, is there a way that I can actually find and dig in through the protocol to find a specific client and what’s going on with that client?” One of the ways that we were able to do that and solve that problem was to use what is the data filters. Let’s jump in, and you can follow along as we go through and look how to use data filters in InsightIQ.
Log back into our InsightIQ environment, and you can see here that I’m pulling a report from a specific time range that I know I’ve got some information in my cluster. Once again, this is my development cluster, so I’ve only got one node connected, but I wanted to come through and look at some of the information we can look at. I’ve got a customized report that’s just a standard report on the Henson cluster, here. You can see that I’ve got it broken down into CPU utilization, connected clients, and external throughput. Those are the top three reports that we’re actually looking for, but let’s look through and see how we can use these data filters. One of the things you can do here is you can actually add a rule. This will work on any of the report types. I’m using the same report, but you can use any of the standard reports or the reports that you have to be able to filter the data. It’s just as easy as adding a specific rule. Let’s come in here, and let’s say that, hey. We’re looking for a specific client, and we’ll see all the information about that one client. Maybe you have a cluster, and if you come down here, and you were able to break it down, specifically with using these breakouts, these clients. Say you have more than I have in my environment. You’ve got thousands or hundreds of thousands, or you’ve got a ton of different clients, and you don’t want to break those down. You can’t really see what’s going on. A quick way to do that is to come in here and add a rule. Add a rule. You can see that we can break it down even by nodes or clients, paths, services, protocols. We’re going to do client. Specifically, I’m going to put in our IP address here. I want to put in an IP address, and now I can apply that rule. Now, you can see here, we’re showing our connected clients. We’re showing all our specific throughput just from this one client right here. In this report here, you can see it’s pulling out, hey, we’re only looking at this specific client and pulling that information. You can add more than just one, too. You can add another rule, and say, “Hey, you know, we want to look at a protocol perspective. We want to see it in smb2, or we could’ve done nfs, or smb1. If you were looking for smb1, or your SyncIQ traffic, you can apply that rule, and now you can see my data filters that are going to be keyed right here. We can go down and look, and now we have a data filter that’s showing all my smb2 traffic from my clients, and the information that’s pooling in here. You can add multiple rules, or you can delete these rules. You can just manage all those from here. Like I said, you could also apply those to any reports. I’m applying it to my standard report that I pulled, but if you wanted to go in and do it on these, cluster. Maybe you’ve just got the cluster performance or the client performance report. You can do that and build these into your reports as well. That’s all we have today for Unstructured Data Quick Tips. If you have an idea for a show or have a question, put it in the comments section here below, and I’ll do my best to answer them.


